
Customer Analytics - Optimizing network and marketing thanks to deep customer insights
Context
Our client is a public company ensuring bus transport services. Its network offers urban and regional buses to a large population. This company recently started to collect high volume of ticket sales and stamps data. This new material was the opportunity to accelerate the Group digital strategy and to improve its knowledge about customer profiles. Our client decided that the first strategic use of this granular data would be to identify and understand the different profiles hidden among its customers. With various datasets available, such as sales, ticketing, stamping, profile or sociodemographic data, the objective was to better understand customers’ behavior. This project would then help to adapt offers and communication regarding the data-driven key learnings.
What did we do ?
MFG Labs mission was to provide a customer segmentation, highlighting customer differences in term of profile, behavior, sales. Based on this segmentation, our client would like to deep dive into three high value chosen use cases.
Solutions
Understanding clients’ behavior
This is a problem which can lead to a lot of analysis. We first needed to structure the project on specific analysis and modeling task with high potential value to our client.
Exploratory analysis
The first move was to collect and run an exploratory analysis of a 1-year history dataset.
This phase enabled to identify relevant variables explaining differences between bus-user behaviors.
For example, the age of the customer has a strong impact on his habits:
- Young customers: they take the bus mainly from Monday to Friday around 7:30am and 4:15pm, rarely on the week-ends
- Senior customers: elderly customers take the bus as much during the week as during the week-ends. Their daily pace is different as they have less imperatives compared to young customers.

Hybrid segmentation
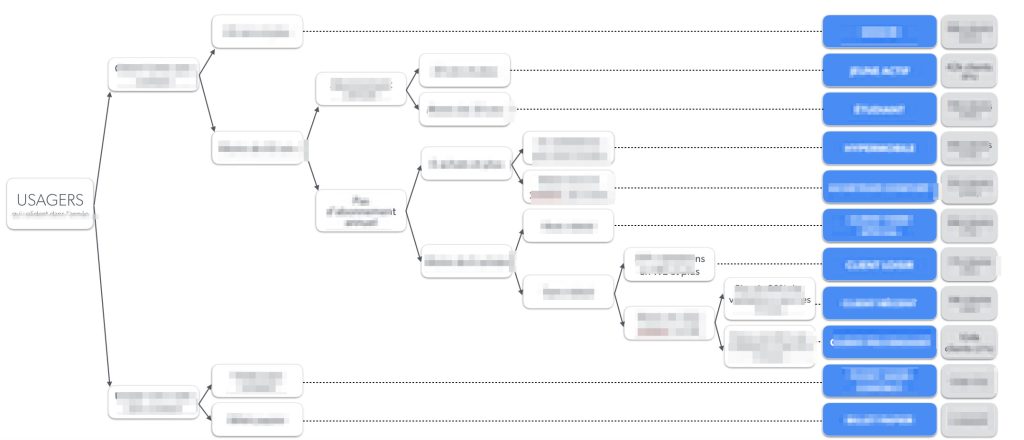
The main objective of this project was to provide an exhaustive customer segmentation. It was essential to harness all possible datasets to obtain complete customers’ profiles. We thus decided to work on two clustering algorithms, and then create a third aggregating both:
- Marketing segmentation: this segmentation is based on profile (age, city of residency, (large) family status…), sales (offer, number of sales, amount…) and macro behavior (number of validation, type of bus lines…) data. It already provides relevant customers’ profiles, but does not consider the temporal customer behavior.
- Habits segmentation: this second algorithm is based on daily and weekly uses of the bus network (validation from Monday to Friday at 7am, validation exclusively on the week end…). It requires the extraction of a habits dictionary from the ticketing data. We obtained a customer segmentation gathering customers with the same habits: for example segment #1 with all customers taking the bus from Monday to Friday at 6:30am.
- Aggregated segmentation: Once the segmentations of bus users were made, MFG Labs consolidated both to obtain an exhaustive representation of the customers’ profiles. Each profile having specific habits, sales and ticketing behavior.
This segmentation is a decision support tool which helps the management team taking strategic and data-driven decisions. By looking at the customer profiles, our client can now adapt the communication and marketing strategy to target specific people. They can thus maintain their customers in a segment or upgrade them to a better segment.
After building the customer segmentation, we elaborated a list of +10 relevant case studies thanks to a collaborative idea generation workshop with the client.
Among them, we highlighted the three most impactful case studies, and we digged further into data to discover new patterns from another angle.
| Case study | Client need |
| New customers | Who are the new customers in term of profile, sales, habits ? How can we address them? |
| Churn | What are the specificities of customer turnover in term of profile, sales, habits ? Can we detect them before departure? |
| Bus network performance | How many customers are there in each bus line? |
Case study #1: New customer understanding
- Who are our new customers?
This question can lead to a lot of analysis, we decided to split this use case into 3 specific questions.
- What is the new customers’ profile?
We compared the new customers’ population to the whole customers’ population in order to highlight its specificities. Our client offers competitive pricing package depending on the age of the customer.
When a customer switch ages rank, we could observe an inflexion in the population of new clients. For example when customers enter in the senior age rank, they massively buy a transport card. This pattern can be explained by the change of pricing strategy (lower pricing for elderly people).
- What are the first sales actions?
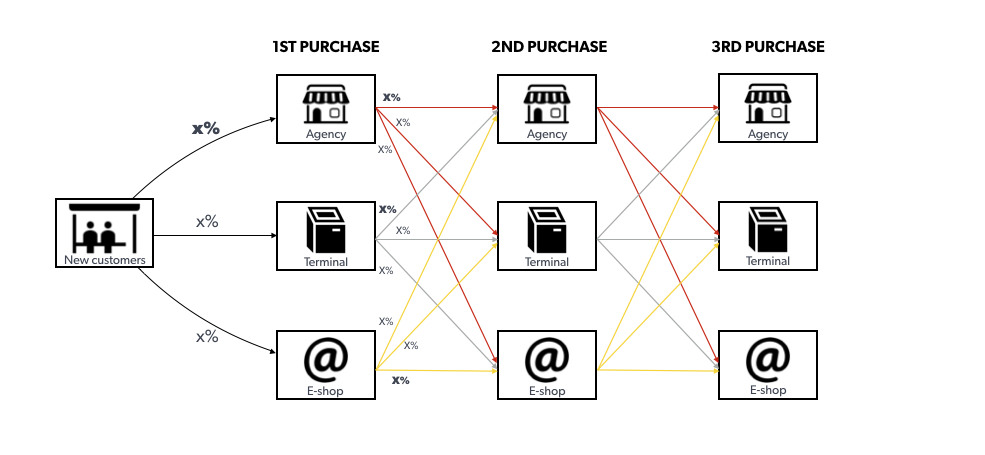
Through several data analysis, we were able to design the first steps of the new comers’ customer journey.
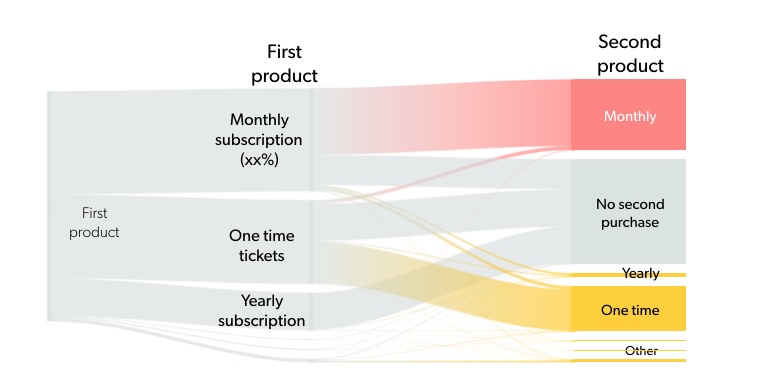
In terms of transport product bought (monthly subscription, yearly subscription, one-time ticket…)
In terms of sales channel i.e. where they first buy (agencies, e-shop, vending machine)
- How do they use the bus network on the first weeks?
We had a look at the tickets new customers were using:
- Some people started immediately with a subscription
- Others started to use the bus with ‘one-time tickets’ and after a specific period bought a subscription.
We were able to identify the period when the customer is discovering the bus services. This exploratory period is the window of opportunity when our client communication has a strong impact on new customers’ choices.
This case study provides strategic learnings to our client marketing and communication department. Based on this data-driven results they could adapt their strategy to answer the new customers’ needs.
Case study #2: Churn prediction
We have split this case study in 2 questions: what are the reasons of churn ? Can we detect churners before they leave?
By harnessing the sales, ticketing and profiles datasets, we realized the reasons of churn could be: the end of free services for the children, the purchase of a car after high school and other various reasons. Moreover, before actually stopping to use the bus network, customers change their behaviors: they reduce their frequency of purchase and ticketing.
We had thus enough knowledge to build profiles of customer to watch closely.
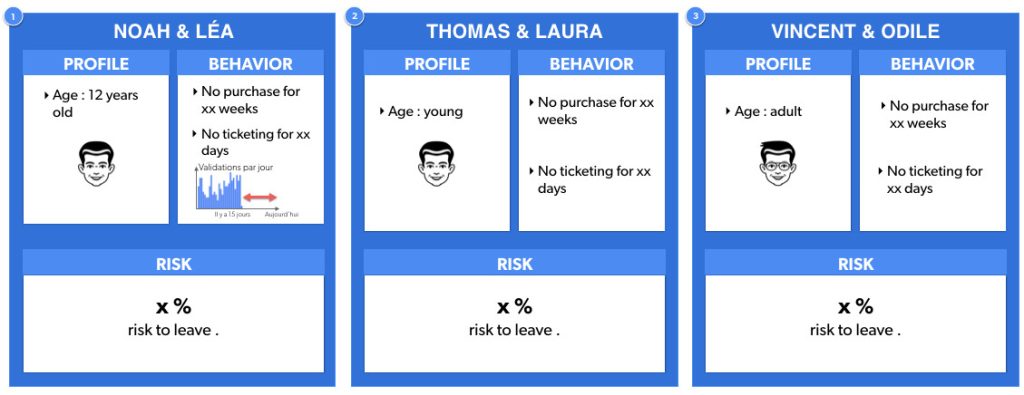
These results are highly interesting for our client’s communication department, and give them actionable insights to improve retention: by detecting risky customers before churn, and the reason why, they can communicate and adapt their message to these targeted customers.
Case study #3: Bus network performance
The third strategic use case derived from our segmentation analysis was to analyze our client’s bus network, and to measure its performance. In this study, the performance can be associated to the bus charge, i.e. the number of users per bus at any time. Now if you want to measure correctly the bus charge, you can look at the number of people on-board for a bus ligne, on a specific day, between 2 bus stations. As we only had the ticketing data, the solution was to determine for every customer when he gets in and when he gets out of a bus.
In other bus networks, in the Netherlends for instance, every customer must stamps (i.e validate) its bus card both when starting and ending his journey. In our client network, users only validates when starting: we thus do not know exactly when they get off. To measure the network performance, the challenge was to build an algorithm estimating where a customer get off a bus.
After the modeling process we were able for each bus line to visualize the number of people between two stations on a map.
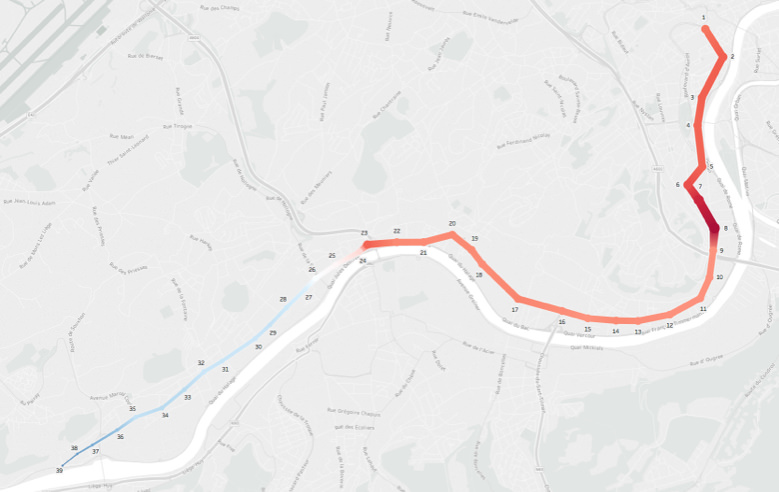
This visualization tool offers the opportunity to detect the low performance areas and to optimize the bus network.
Results
This project provided several strategic and actionable elements to our client:
- Data-driven and actionable recommendations to all departments: marketing, communication, network operations
- A better understanding of bus users with a customer segmentation based on behaviors and temporal habits. Based on this segmentationc, specific focus have been made on high value use cases
- An audit of our client’s system and system recommendations to ease datasets harnessing
- An exposure to the high potential of their datasets and the strategic insights that can come out of them